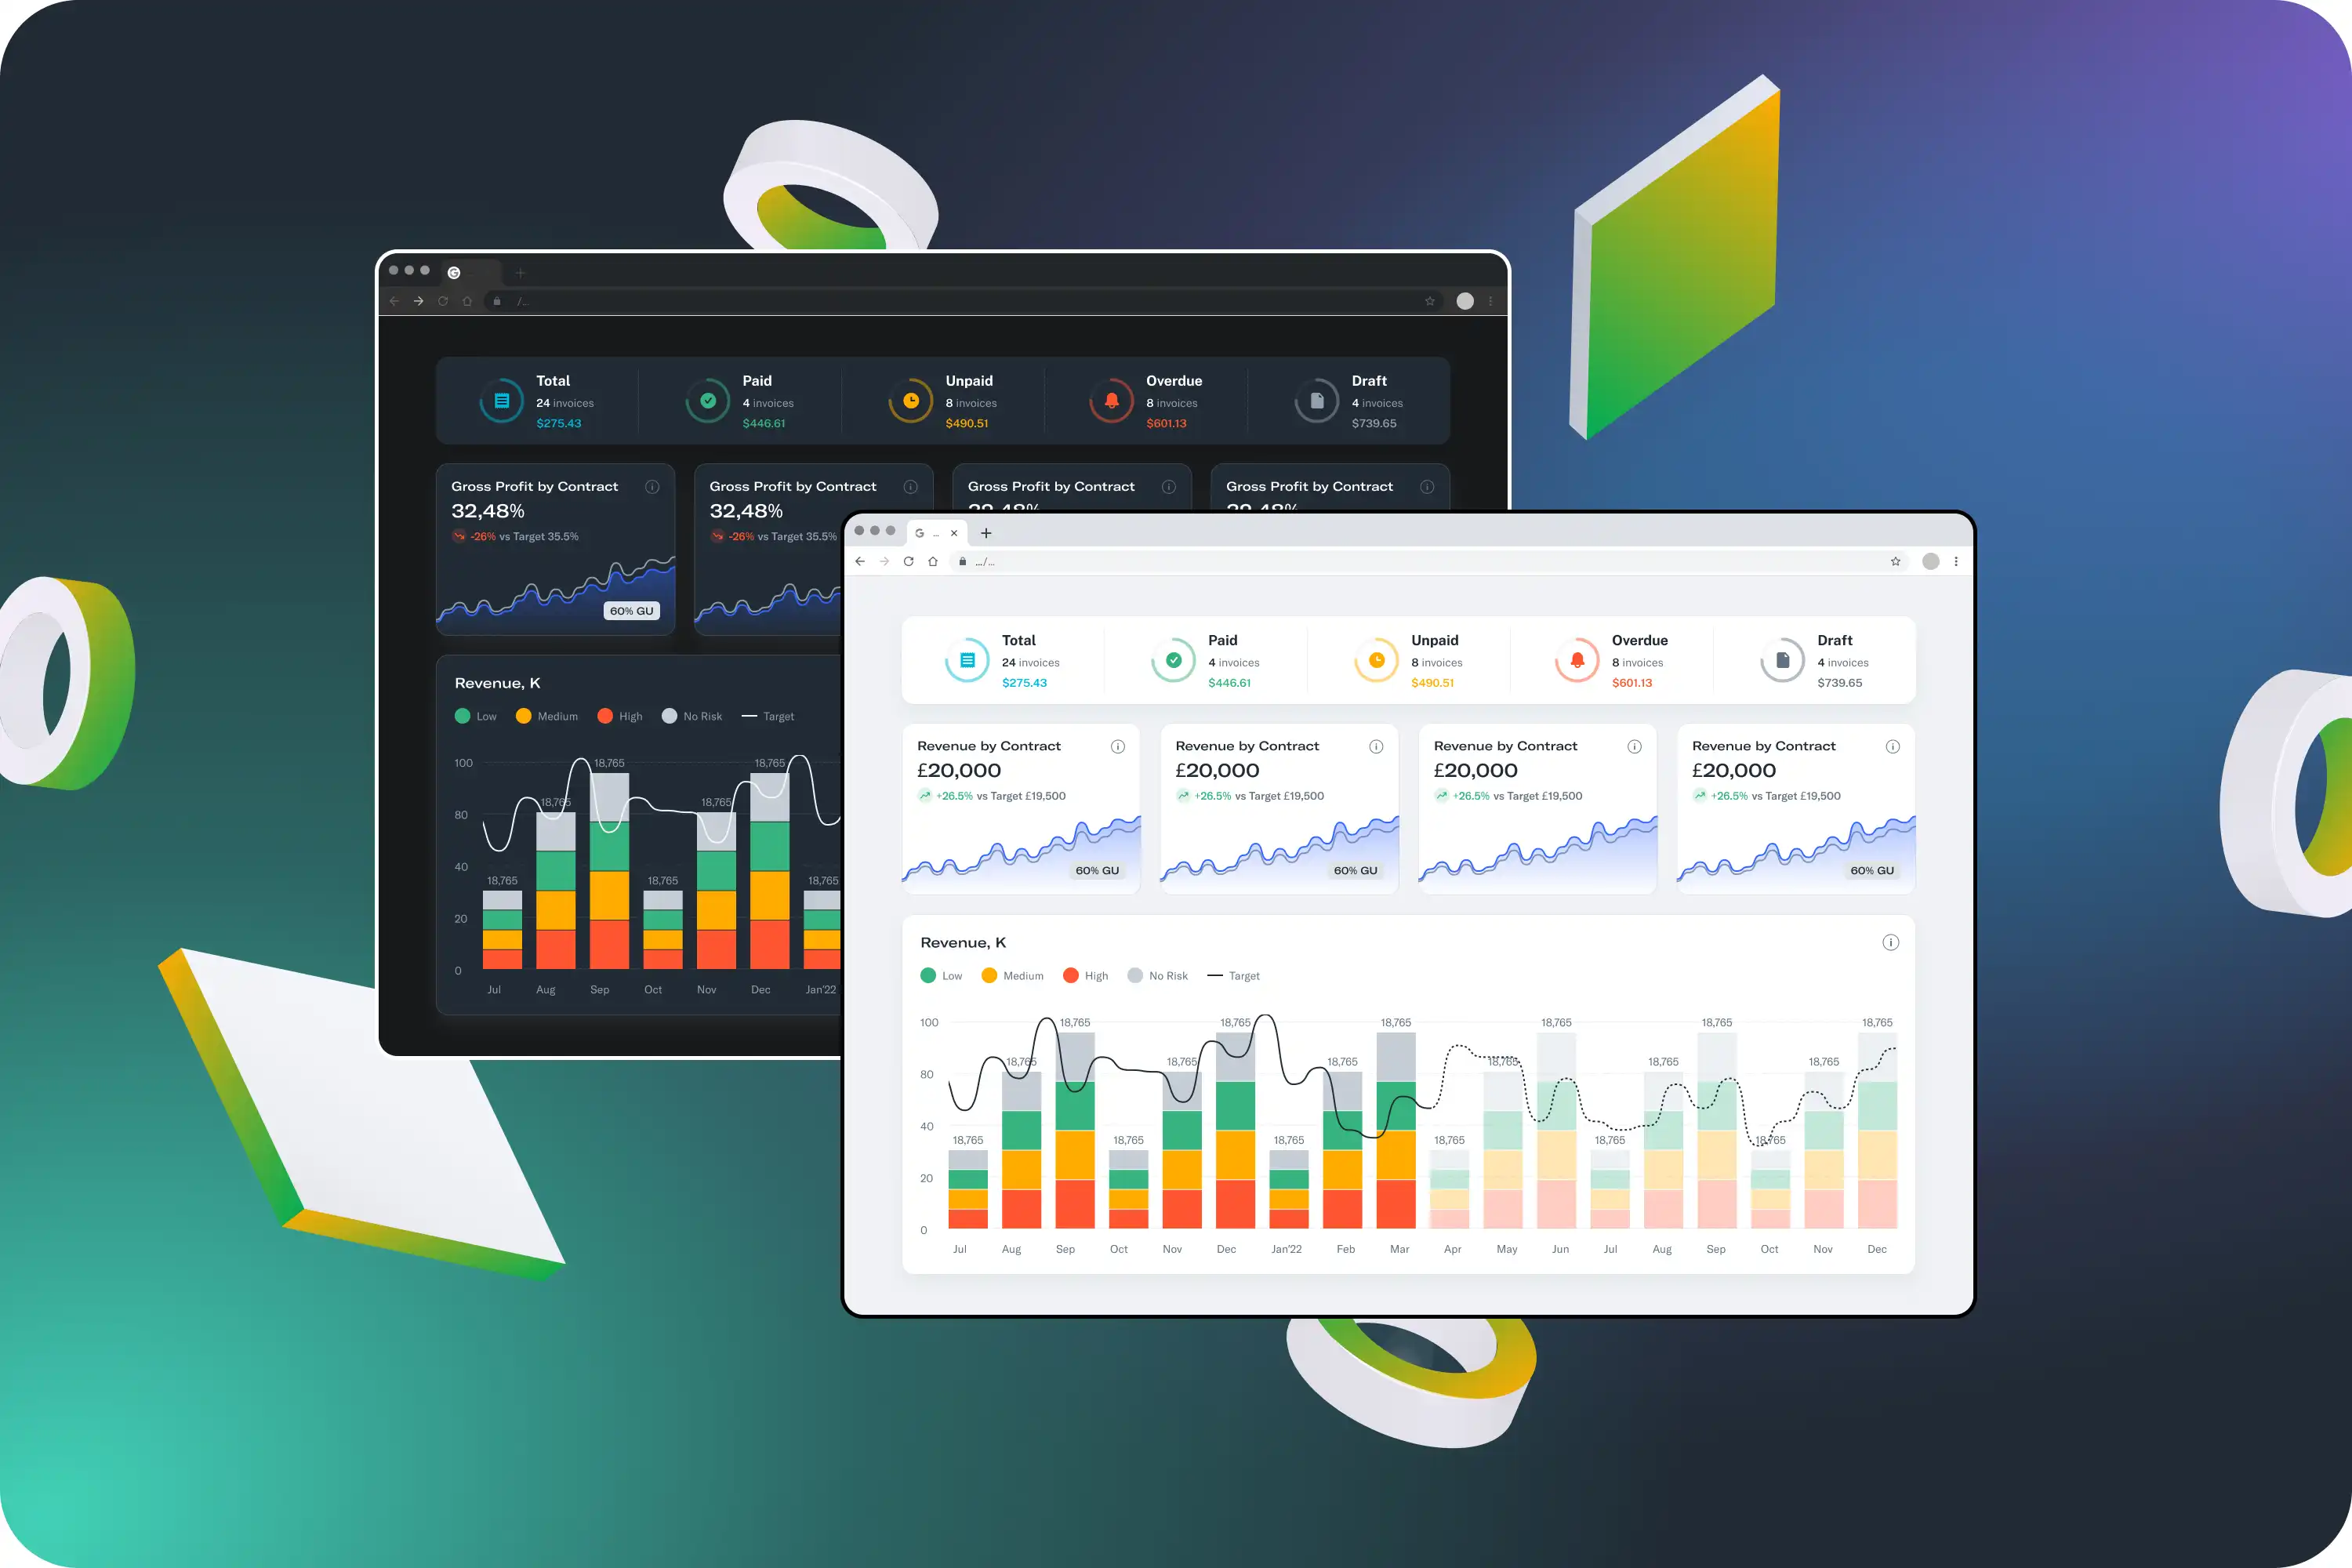
Stop guessing. Taking a shot in the dark is futile. Instead, you must gain full clarity on how every campaign, email, and automation performs with dynamic, clear reports, transforming data into practical takeaways.
A holistic dashboard shows all the campaigns and automations and updates them in real time. No more switching tabs.
Focus on the Key Performance Indicators (KPIs) that really matter. At TrueSend, we focus on the insights that actually fuel decisions, from campaign metrics to customer journeys and revenue generation.
Monitor open and click rates, click-to-open ratio, unsubscribes, bounce rates, and time-of-open. All these must be evaluated not only at the campaign but also at the individual subscriber level.
Know exactly how much revenue each email generates, linked directly to the campaign, automation step, or specific link that led to the purchase.
Monitor subscriber growth, churn rates, engagement scores, cohort behaviour, and segment performance, all in one live, unified view.
Over 200 individual data points are tracked across your entire email program, from the first message sent to the final purchase made.
Monitor unique opens, total opens, reading time, and repeat opens, and distinguish between machine opens and real human opens, with Apple MPP filtering included.
ExploreVisual heatmaps reveal specifically where subscribers click within your email. Hence, it becomes easy to recognise the content, which leads to higher engagement.
ExploreComprehensive email attribution tying revenue, order volume, AOV, and conversion metrics directly to campaign execution.
ExploreMonitor subscriber acquisition, list attrition, net growth, and multi-touch attribution—tracing every signup back to its specific form, ad, or landing page alongside list health analytics.
ExploreMonitor real-time inbox placement, spam filter results, bounce categories, and domain/IP reputation across more than 50 ISPs.
ExploreView step-by-step performance for every automation workflow, identify drop-off points, high-converting paths, and the total revenue generated by each sequence.
ExploreUnderstand which devices (mobile or desktop), email clients (Gmail, Outlook, Apple Mail), and operating systems your subscribers are using.
ExploreAccess country, city, and timezone insights for opens, clicks, and revenue, optimising send times and tailoring content to your audience’s location.
ExploreCompare results across audience segments, signup cohorts, and custom fields to identify your most valuable groups and focus on what works best.
ExplorePick from ready-to-use designs for specific goals. Build your own personalised reporting view.
Campaign
Complete every campaign’s analysis. This includes opens, clicks, bounces, unsubscribes, and revenue, other than comparisons with earlier campaigns and performance standards.
Revenue
Connect every dollar generated from email to the exact campaign, link, and subscriber responsible. Full e-commerce attribution with detailed order tracking.
Deliverability
Track inbox placement, bounce rates, spam complaints, and domain reputation across major ISPs before problems affect your sender score.
Audience
Discover subscriber gains, retention trends, and churn signals.. Segment traffic across organic, paid, and referral channels alongside audience engagement score trends.
Automation
Step-by-step reporting for each workflow. Entry rates, completion rates, revenue per path and where subscribers exit the automation.
Benchmarks
What is the average email performance across your industry? At a glance, see if your KPIs fall short of or exceed the average.
Revenue attribution eliminates any guessing when it comes to measuring email marketing effectiveness. View the real revenue, order count, and ROI for each email.
Each email displays its total revenue, number of orders generated, average order value, and conversion rate, all tracked in real time.
Identify which specific links inside your email drive the most clicks, conversions, and revenue helping you replicate what works best.
View any subscriber’s profile to see the total revenue attributed to them throughout their lifetime, enabling accurate lifetime value (LTV) analysis.
Schedule reports to be delivered automatically to your inbox or your client’s inbox, daily, weekly, or monthly, fully formatted and ready to share.
Set it once and receive weekly summaries, monthly digests, or custom-frequency reports delivered automatically to any inbox.
Download any report as PDF, CSV, XLSX, or PNG. Share with stakeholders, import into your BI tools, or include in presentations.
Agencies can create fully branded reports using their logo and colour scheme, with no TrueSend branding displayed.
Access all analytics data programmatically and send metrics directly into your dashboards, BI platforms, or data warehouse using our analytics API.